
Rosary Labs / Blog
Part 1: Evaluating VLM Accuracy on P&IDs
Improving VLM-powered P&ID equipment-tag extraction requires systematic evaluation. We demonstrate how Accuracy, Precision, Recall, and F1-Score can be applied to engineering diagram analysis by treating each extracted tag as a binary classification. The critical challenge is balancing false positives (hallucinated extraction) against false negatives (missing desired extraction).
3 min read, 22 January 2026

How do we evaluate the effectiveness of a VLM?
Following our previous post, Can Vision-Language Models Reliably Extract Equipment Tags from P&IDs?, this article goes deeper into three parts of evaluation: quantitative metrics, implementing quantitative evaluation, and qualitative evaluation.
You may have uploaded Piping & Instrumentation Diagrams (P&IDs) into an AI tool and found that the output is not good enough. You keep tweaking prompts, but how do you track which prompt works and which does not? Or perhaps you built a prototype with PDF cropping and image-contrast preprocessing. How do you advance from a 10% functional prototype to a 90% functioning tool?
There are typically two stages of evaluation:
- Quantitative evaluation — benchmark the tool against an expected outcome.
- Qualitative evaluation — user-test the tool more holistically.
Metrics for quantitative evaluation
Consider a classic computer-vision classification problem: predicting whether images contain cats or dogs. A confusion matrix categorises positive and negative predictions against the actual category.
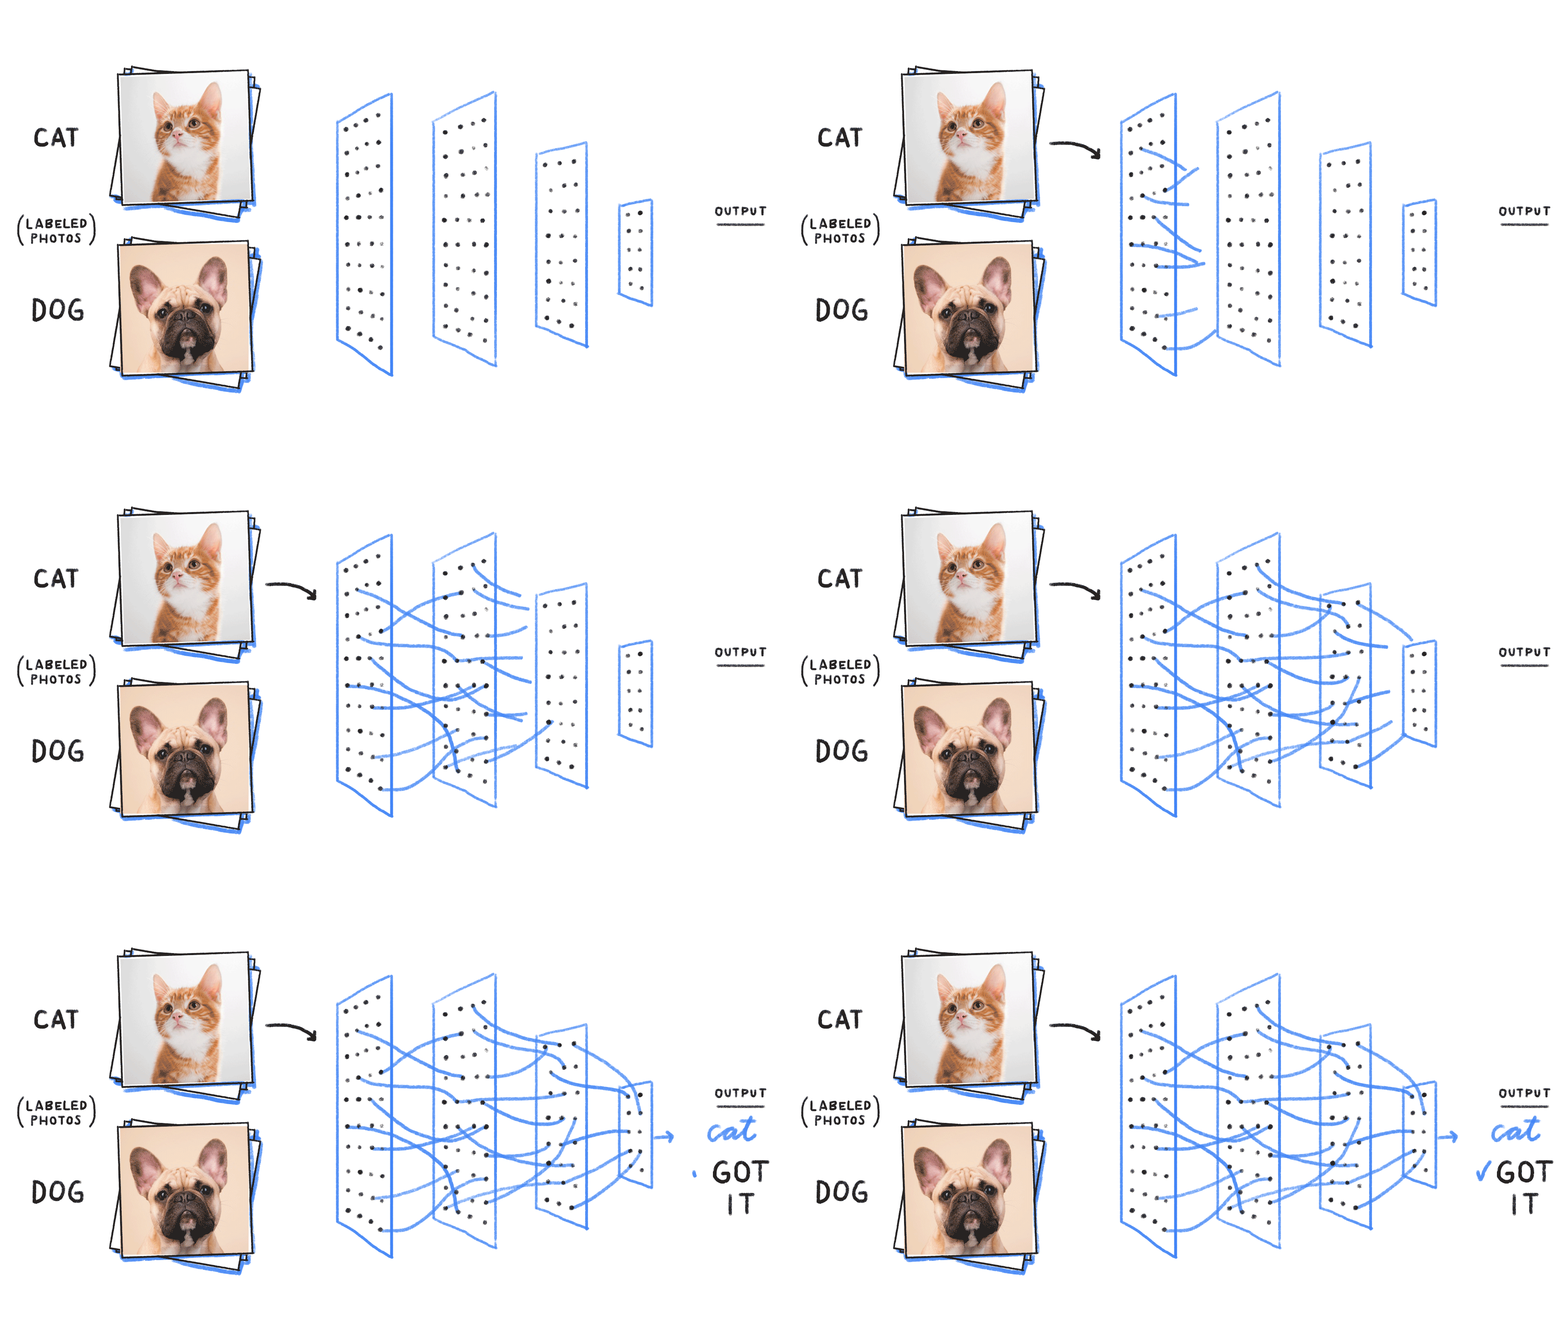
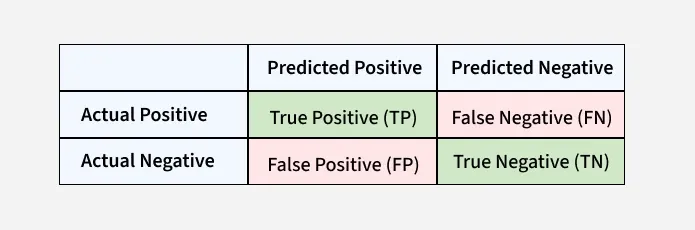
- True Positive: A dog is predicted and the image is an actual dog.
- True Negative: A cat is predicted and the image is an actual cat.
- False Positive: A dog is predicted when the image is a cat.
- False Negative: A cat is predicted when the image is a dog.
This matrix applies directly to P&ID extraction, where each extracted tag is classified as correct or incorrect.
Common classification metrics and the trade-off
The confusion matrix unlocks several metrics:
| Metric | Formula | Use it when |
|---|---|---|
| Accuracy | (TP + TN) / (TP + TN + FP + FN) |
The dataset is balanced. |
| Precision | TP / (TP + FP) |
False positives should be minimised. |
| Recall | TP / (TP + FN) |
Capturing every positive case matters most. |
| F1-Score | 2 · (Precision · Recall) / (Precision + Recall) |
Precision and recall need to be balanced on an imbalanced dataset. |
For P&ID extraction:
- True Positive: The equipment tag exists and the tool extracts the correct tag.
- True Negative: The equipment tag does not exist and the tool does not extract it.
- False Positive: The equipment tag does not exist, but the tool hallucinates a phantom tag.
- False Negative: The equipment tag exists, but the tool misses it.
There is effectively no meaningful true-negative count: there can be an infinite number of equipment tags that do not exist, and the tool does not extract them. Ideally, we want high true positives and low false positives and false negatives.
False positives pose a greater risk because they create non-existent engineering information. False negatives are also undesirable because the extraction becomes incomplete. For this reason, Rosary AEC focuses on F1-Score, with slightly more emphasis on correcting precision.
Key takeaways
- P&ID extraction can be evaluated using traditional classification metrics by treating each extracted item as correct or incorrect.
- The confusion-matrix framework (TP, TN, FP, FN) quantifies performance and identifies specific extraction weaknesses.
- Metric selection depends on the relative cost of false positives and false negatives.
- F1-Score is the preferred metric for VLM-powered P&ID extraction because both hallucinated and missed tags are problematic.
In the next article, we will uncover how quantitative evaluation can be implemented into the P&ID extraction pipeline.